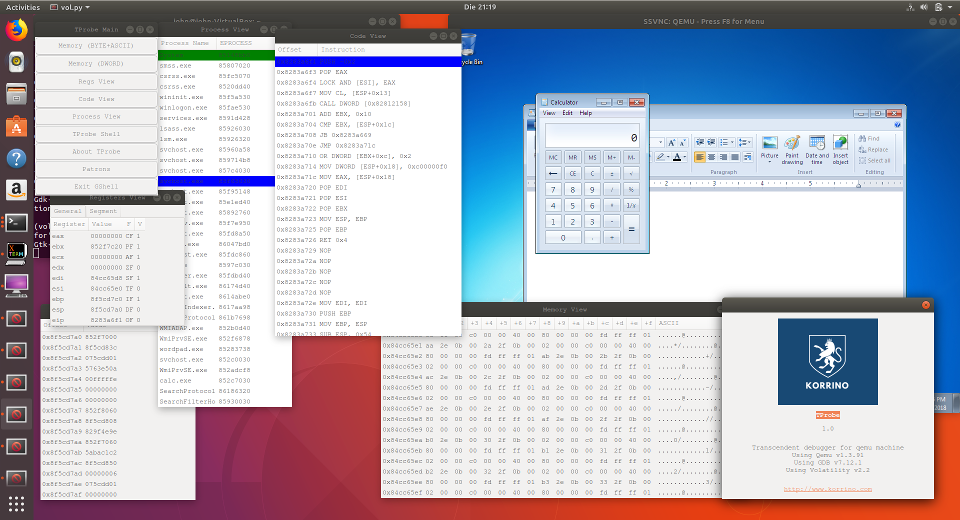
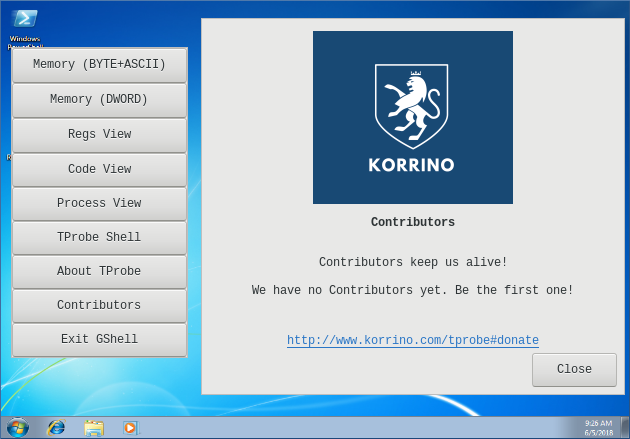
TProbe is an instrospection debugger. It's a fork project originating from Heisenberg project developed in
Polish Chapter of the international
Honeynet Project organisation.
Debugger is a tool that can be used to analyze how software works. It basically allows analyst to slow down execution of series of instructions that are part of a software - programs, drivers, even operating system or firmware and examine how these instructions relate to the whole system. For example: are they supposed to perform legitimate operations that serve business processes of your organisation or is it designed to damage them.
The name "debugger" can be somewhat misleading, it suggests that debuggers are used exclusively to find and analyze bugs. In order to understand properly what you can do with a debugger, it's good to imagine it as a diagnostic software that enables you to look at software as if "under the microscope". Finding bugs is just one of many things that you can do with it.
The "introspection" part of name highlights the primary difference between TProbe and majority of other debuggers. It means that all debugging components are removed from environment of analyzed software. The analysis process is performed by examining parts of memory and registers from outside of debugged environment.
It has several far reaching consequences, most important being:
1. Malware has difficult time determining if it's being analyzed. It's harder to deploy counter-analysis tactics (also: anti-debugging techniques)
2. Analyst has access to all data within a system. This means that he can examine memory from perspective of different user processes and even drivers and kernel